This is an overview of a system to plot various
representations of objects with surfaces and curves having known functions, spatial
rays, maps and other graphs, using almost any coordinate system, developed
primarily at the Massachusetts Institute of Technology Computer Science and
Artificial Intelligence Laboratories, with additional resources from the Plasma
Science and Fusion Center and the Harvard University Mathematics
Department. These steps were originally
aimed toward roughly illustrating confined plasma behavior which thus far have
yielded a somewhat general set of methods.
| This illustration shows a pair of spheres,
a torus between them, and a bundle of rays, all expressed using toroidal
coordinates, for simplified d-orbital model.
Each of the surfaces indicated have been labeled
with the specific parameter held constant.
Press any linked
image within this document to switch background styles. |
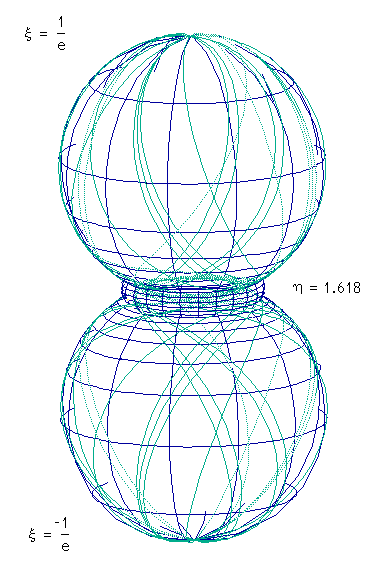 |
Within and behind boundaries, the curves representing surfaces have been silhouetted completely, whereas the orbital rays
are faded instead.
These orbital paths were chosen such that they
revolve within the center torus a few times before and after a single
loop around either sphere.
|
Currently implemented as a class-library for
MIT-Scheme (SOS), this mechanism may be adapted for Common-Lisp (CLOS), C++, and
Java as needed applications arise. It is also intended to
provide point datasets for Auto-Lisp or other rendering and illustration
packages.

Foundations for this particular library are rooted in a
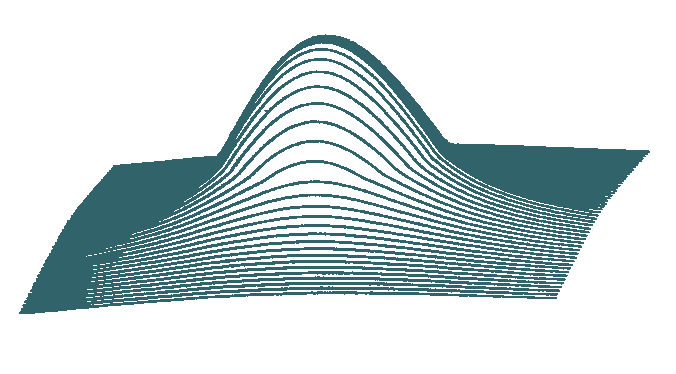
long history with mathematical modeling. Here is an example Cartesian coordinate defined surface,
employing simple ray-tracing for hidden-line removal using Pascal and a
custom low-level (assembly) graphics-library, plotted originally onto a Tektronix-4015 with a
DecSystem-2060 running TOPS at Tulane University in 1983:
|
 |
|
Similar illustrations were produced using this earlier
library with Fortran and Pascal for the Tulane Physics and Chemistry Departments
during 1979-1984 for analysis of X-ray diffraction, nuclear emission,
gravitational model, and astronomy related data. Addition of interrupt
service handlers lead to more direct parameter controls for these applications
and to an "Asteroids"-like video-game.
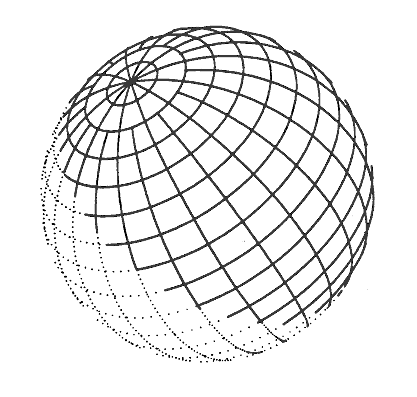
| Removing hidden elements from a spherical object can
easily be accomplished by merely noticing where the plane through its
center is perpendicular to the view position.
This technique can again be applied for a light
source direction in order to provide the effect of simple
illumination.
This is another image first generated
using Fortran and the same hardware and graphics-library circa 1980:
|
 |
 |
Evolving into Pascal this globe
drawing program eventually incorporated the ability to zoom and show
simple maps.
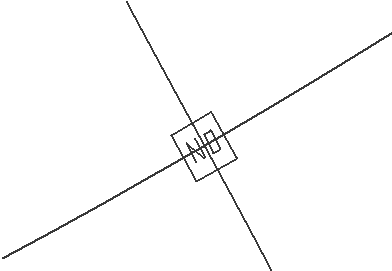
In this adjacent scan highlight of a screen dump
from 1982 is a small map representing New Orleans centered around 90-W,
30-N.
|
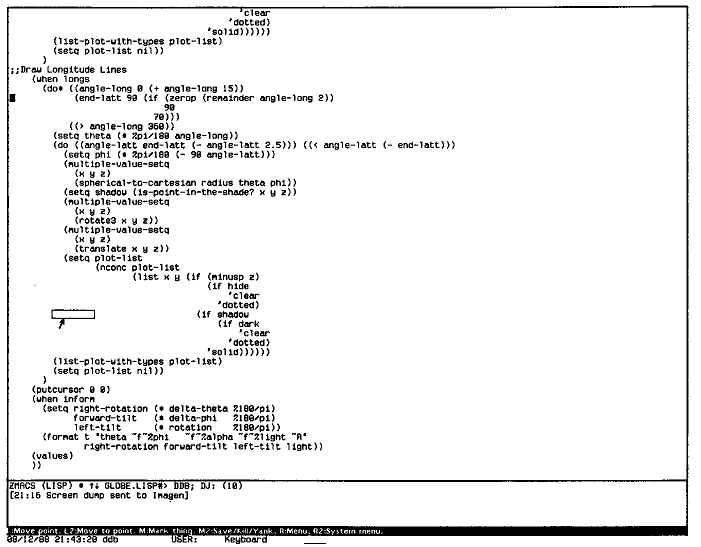
Code clips from these earlier examples would require scanning of old dot-matrix hardcopies,
though here
is a screen-shot of some equivalent code in Zeta-Lisp used to draw the previous
globe object on an LMI-Lambda in
1988:
Generalizations of the techniques used in this set of
older examples are ultimately being merged into this newer graphics-library
version, along with a
variety of other methods to facilitate representation of less uniform shapes.

Representations of arbitrary objects in any coordinate
system, which are also meant to have hidden elements around contours, present
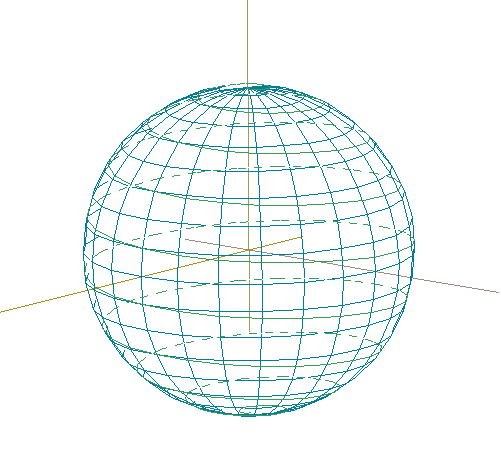
interesting challenges requiring more general methods. In this illustration, created using MIT-Scheme and the
class-library described herein, the elements meant to be hidden are removed
according to a silhouette of the object, in this case slightly smaller in radius
than the sphere drawn:
|
z-axis |
|
|
x-axis |
 |
y-axis |
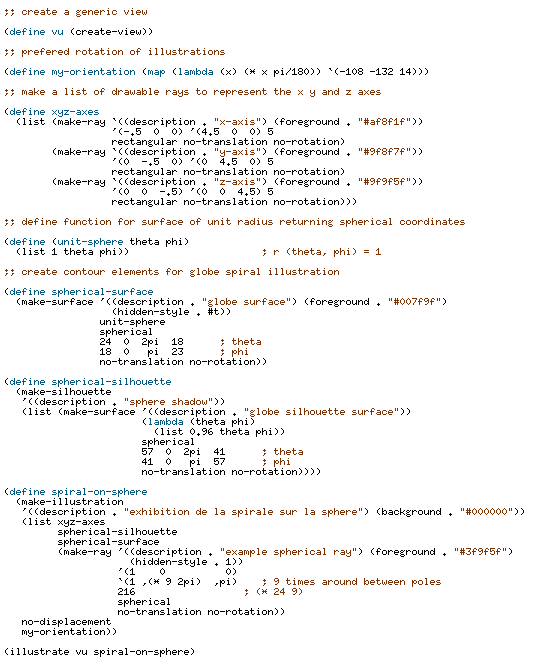
Here are the code expressions which produced this
drawing:
Certainly there are easier, less intensive methods for
obtaining the same effect, but proof of concept suggests some readiness for surfaces expressed with
other coordinate-systems.

After adding conversion functions for various confocal
coordinate systems (and their dependent hyperbolic trigonometric functions), it
becomes possible to illustrate other interesting shapes, knowing something
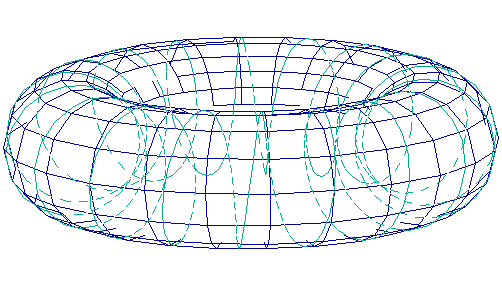
about the necessary parameters. Here is an example image showing a silhouetted surface and
ray using toroidal coordinates:
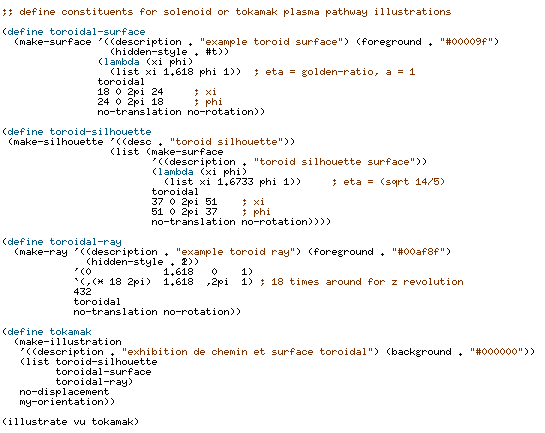
This image was produced with a set of expressions such
as:

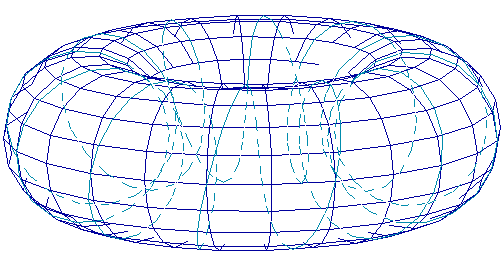
Often several coordinate-systems serve to express
similar contours. Here is another example image of a silhouetted torus and
ray, this time using bicylindrical (cylindrical wrapped around z-axis)
coordinates:
Visual comparison of the size of the panels (tetragons)
on both torus surface examples reveals the uniform radial nature of
bicylindrical, and the hyperbolic nature of toroidal coordinate-systems.
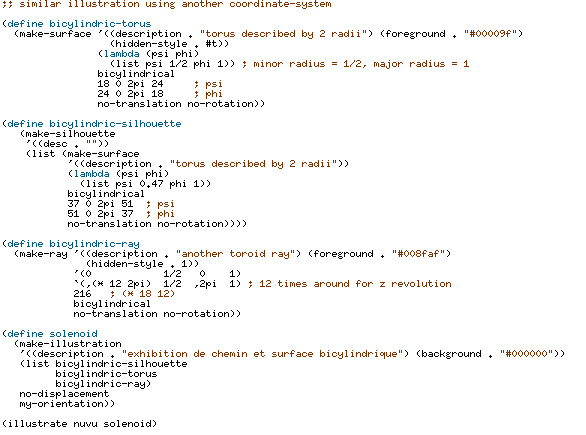
Here are the expressions for the last image:

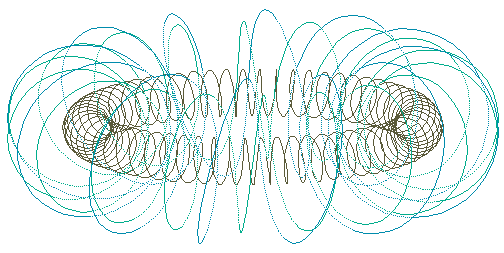
Curves may also be represented using this library as
parameterized functions. This image shows a combination of the previous
silhouetted rays, along with another expression demonstrating such usage:
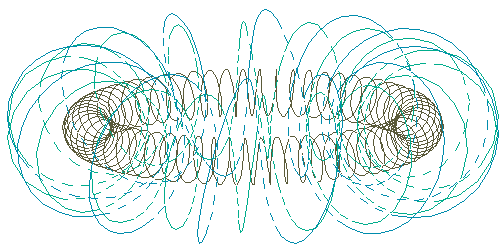
In this case the larger paths are faded where
silhouetted. This example could perhaps represent a possible mode of plasma within
a tokamak, with the outermost pathway for Tritium (H3), the next wider pathway
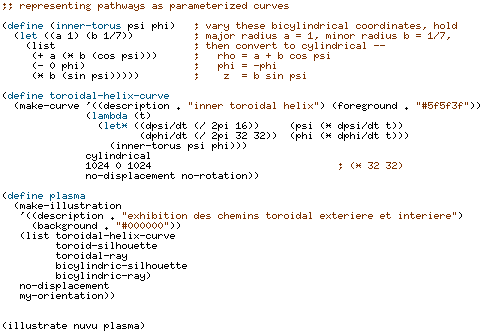
for Deuterium (H2), and the innermost pathway for the electrons. Here is
the code producing this illustration:
This is a similar image with dashed lines where
silhouetted around the middlemost torus:
The following linked
page lists some animation sequences for this tokamak plasma model: tokamak-animation.html

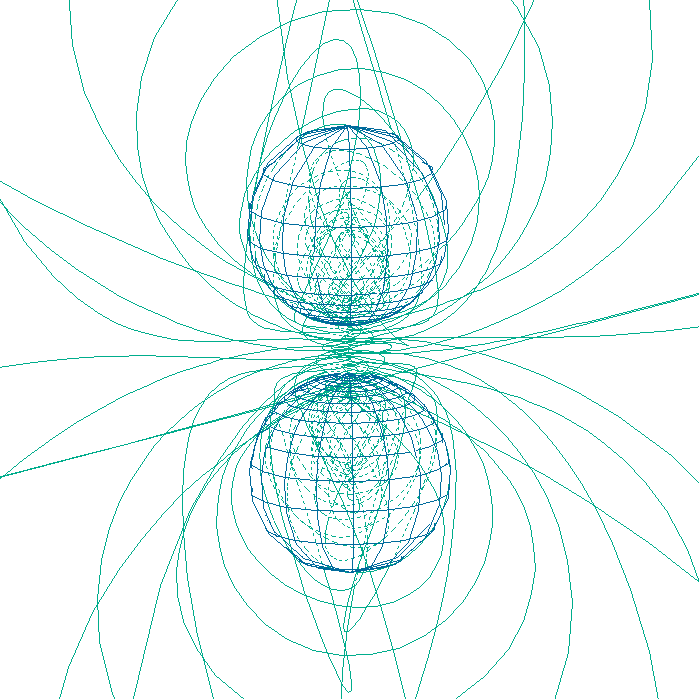
Another use of confocal coordinate-systems might be for
representation of electron orbital pathways. Here are a pair of spheres
and a long ray in bispherical coordinates which might be used to demonstrate
something like a pz orbital
snap-shot:
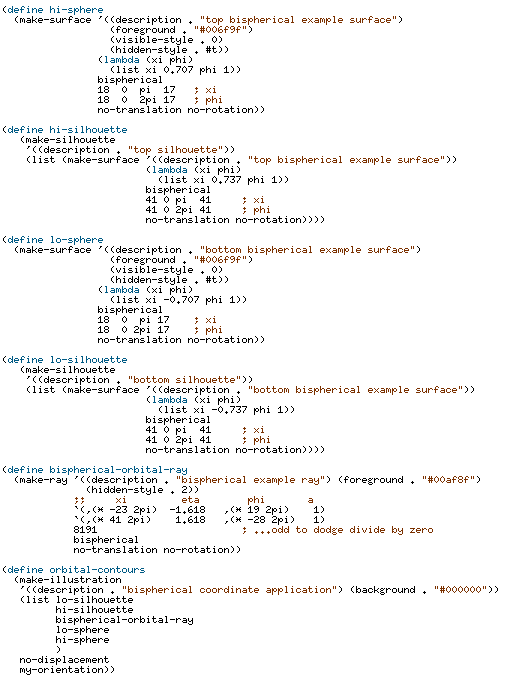
This image was created using this set of expressions:
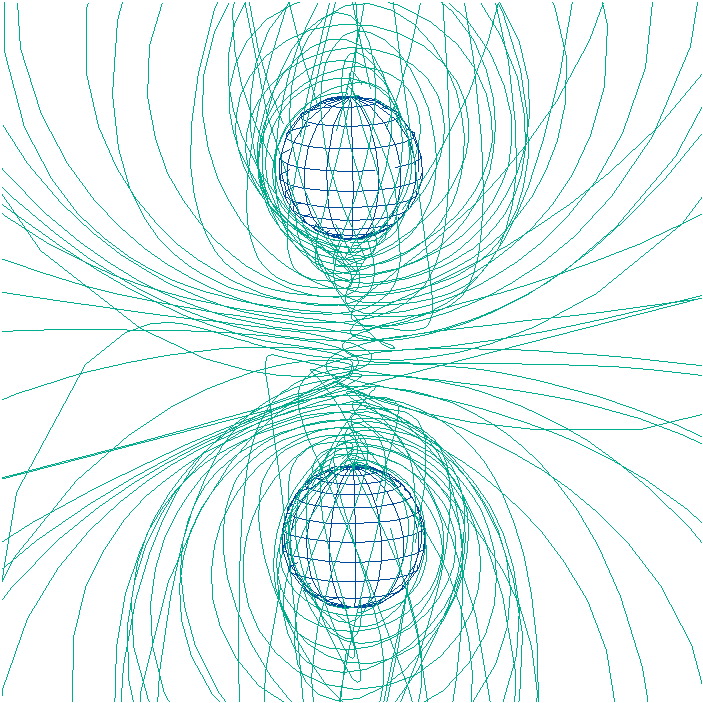
This similar combination has slightly different
parameters:
Again it might be noticed how these sphere surface
tetragons reveal hyperbolic related spacing, whereas the sphere expressed using
spherical coordinates shows more uniform spacing, by analogy to the comparison
of tori using toroidal and bicylindrical coordinates earlier.

These methods currently serve as a means to roughly
analyze the objects or functions describing them, before displaying with, or
without necessarily requiring, other rendering systems.
Following are some older example images and code clips from
the previous version of this custom physical object modeling mechanism with
MIT-Scheme.
This version used structures rather than classes for object
definitions, and so the primitives are somewhat different, though the principles
are basically the same. Most of these images were first created circa 1991
at the MIT AI Lab using HP hardware.

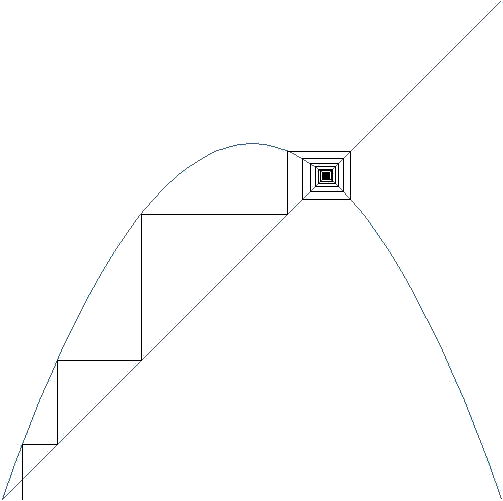
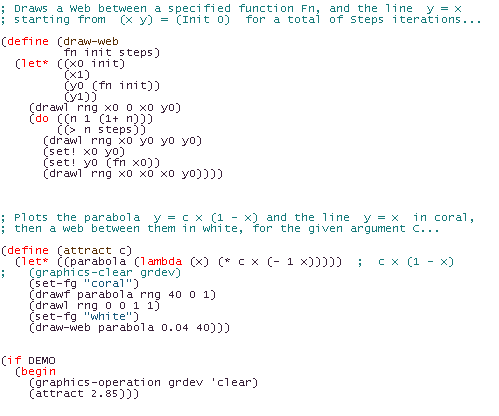
An attractor image (to demonstrate basic iterative convolution or chaos
models):
|
 |
|
|
 |
|
|

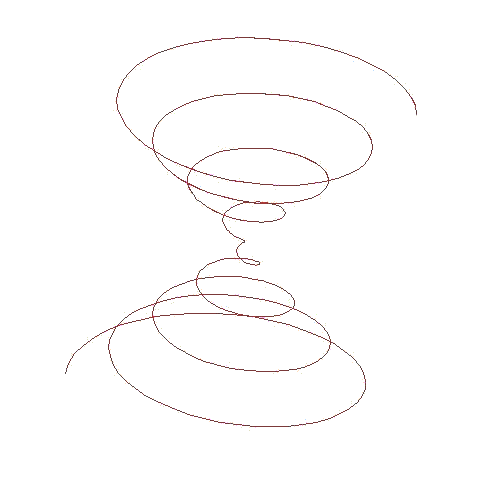
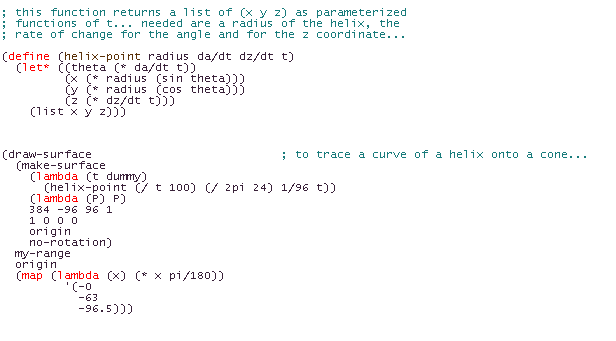
Trace of helix onto conic surface (could be particle moving through E-M
hourglass or mirror):

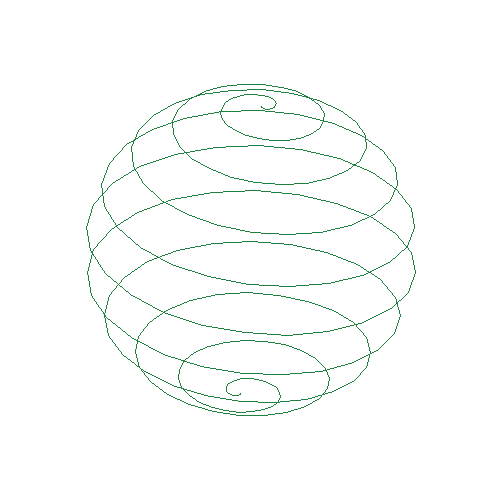
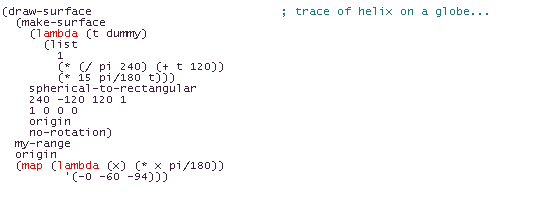
Trace of helix onto spherical surface:

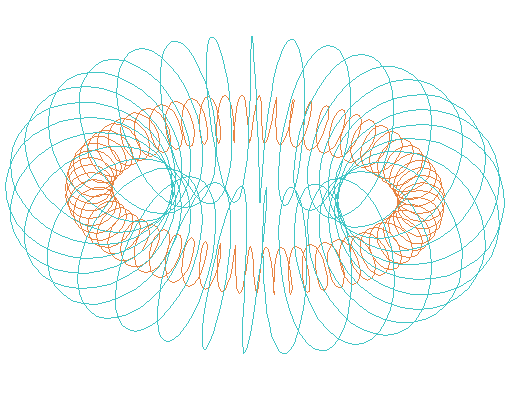
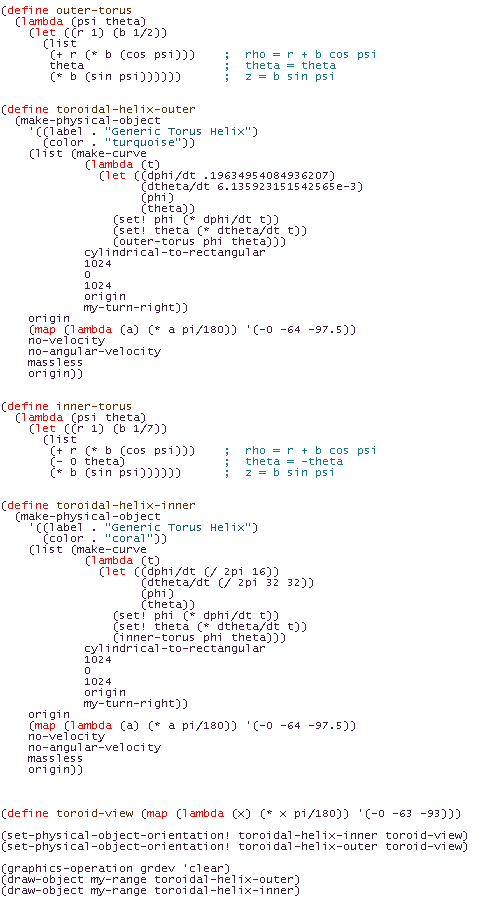
Double Toroidal Helix for simple model of tokamak plasma ions (outside) and
electrons (inside):


